Get the Tata Capital App to apply for Loans & manage your account. Download Now

Blogs

SUPPORT

Tata Capital > Blog > Wealth Services > What is Rolling Return? Meaning, Importance and Calculation

Wealth Services

What is Rolling Return? Meaning, Importance and Calculation

What is Rolling Return? Meaning, Importance and Calculation

Summary: When you check a fund’s 1-year or 3-year return, you are looking at a single snapshot between two fixed dates, and that snapshot can flatter a fund or unfairly punish it depending purely on when the measurement starts. Rolling returns solve this by measuring performance across many overlapping periods, thereby giving you a fuller picture of how consistently a fund has actually performed. This blog covers the meaning of rolling returns, why they are a fairer measure than trailing returns, how they are calculated with a worked example, and how to use them when evaluating a fund.

Rolling returns exist to solve a specific problem with how fund performance is usually shown to you. When you look up a fund’s 1-year or 3-year return on a factsheet, that figure depends heavily on the exact start and end dates used. A date near a market low can make an average fund look excellent, while a date near a peak can make a genuinely good fund look weak. A rolling return corrects for this by measuring the fund’s performance across many overlapping periods rather than just one, so you get a sense of how consistent the fund has actually been across different market conditions. Let’s look into what rolling returns of mutual funds mean, why they give you a fairer read than trailing returns, how the calculation works with a worked example, and how you can use this measure when comparing funds.

Rolling Returns Meaning

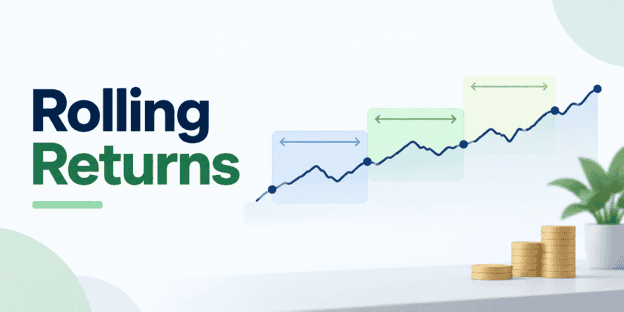
A rolling return is the annualised return of a fund measured over a fixed period, such as 3 years, calculated repeatedly for every possible start date across its history and then averaged. It shows how consistently the fund has performed across different market conditions, rather than the outcome of just two dates. That is the rolling returns meaning worth carrying into every fact sheet you read from here on.

If we see in practical terms, instead of asking “how did this fund do between January 2021 and January 2024,” a rolling return asks that same question hundreds of times, once for every possible starting month in the fund’s history, and then looks at the whole set of answers together. This shift, from one measurement to many, is exactly what separates rolling return mutual fund analysis from the trailing figures you usually see quoted.

Also Read – Types of mutual funds in India

Trailing (Point-to-Point) vs Rolling Returns: Why It Matters

Trailing returns, the 1-year, 3-year and 5-year figures printed on most factsheets measure performance between two fixed dates. They are simple to calculate and easy to read, but that simplicity comes at a cost. They are highly date-sensitive.

A trailing return that happens to start near a market low will look inflated, while one that starts near a market peak will look unfairly weak. This sensitivity is exactly what fuels recency bias, i.e., the tendency to chase whichever fund had the best headline number last year.

Consider a hypothetical example. Let’s say a fund’s 3-year trailing return measured from January 2020 could show 8% annualised. The same fund’s 3-year trailing return measured from January 2021 could show 18% annualised, purely because of where each window happened to start and end. Rolling returns address this by averaging across many overlapping windows and market cycles, which further reveals consistency rather than a single lucky or unlucky measurement.

So what are rolling returns correcting for, in effect? Exactly this kind of date-driven distortion. This does not make trailing returns “wrong,” they still tell you something real about a specific period. However, they are simply incomplete on their own.

The honest takeaway is to treat rolling returns of mutual funds as your first fairer filter, and trailing returns as one additional data point rather than the whole picture.

Also Read – PMS vs Mutual Fund

Why Rolling Returns Are Important

Once you understand why a single trailing figure can mislead you, the value of a consistency-based measure becomes clearer. Rolling returns matter for four connected reasons.

  1. They show consistency across market cycles rather than performance during one favourable window, which tells you whether a fund’s good years were a pattern or a coincidence.
  2. They allow a fairer comparison against peers and benchmarks, since every fund is measured across the same overlapping set of periods rather than whichever two dates happen to flatter it.
  3. They reveal the range of outcomes, the best period and the worst period a fund has produced, so you understand the downside you might face rather than only the average.
  4. They reduce recency bias, the habit of buying into a fund simply because its most recent headline number looks impressive.

Put together, what are rolling returns really answering is a single practical question, i.e., how dependable is this fund likely to be over time, rather than how well did it do in one specific stretch. That is exactly why mutual fund rolling returns data is worth checking before you form a view on any scheme.

This measure is most useful for long-horizon equity fund selection, where market cycles genuinely play out over years, and it is worth noting that even a strong rolling-return record is reassuring, not a guarantee of what comes next. That caveat becomes more concrete once you see exactly how the numbers behind a rolling return are actually built.

Read More – Key SIP rules & 7-5-3-1

How to Calculate Rolling Returns

The calculation follows a consistent method, regardless of which fund or period you apply it to:

  1. Choose a window and a frequency. Decide on the period you want to measure (commonly 3 years for equity funds) and how often you will recalculate it, i.e., daily, weekly or monthly.
  2. Compute the annualised return for each start date. For every possible starting point in the fund’s history, calculate the annualised return over that window length.
  3. Roll the window forward across the full history. Repeat step 2 for every subsequent start date, generating a large set of overlapping return figures rather than a single number.
  4. Analyse the average, minimum, maximum, and consistency. Look at the average of all these figures, the lowest and highest values in the set (the range), and the percentage of periods that beat a chosen benchmark return.

Suppose you calculate 3-year annualised returns for a fund starting in three different months.

  • The window starting January 2018 shows 15%
  • The window starting January 2019 shows 9%
  • The window starting January 2020 shows 13%

These figures are illustrative only and not drawn from any actual scheme. Averaging the three gives roughly 12.3%, the range runs from 9% to 15%, and if your benchmark target is 8%, all three periods in this small example clear it.

This kind of rolling return calculation, run across dozens or hundreds of overlapping windows in practice, is what allows a statement like “this fund cleared 12% annualised in 85% of all 3-year periods” to be made, a far more informative claim than a single figure like “it returned 18% last year.” Applying this same rolling return calculation consistently across every scheme you compare is what turns mutual fund rolling returns data into something you can actually act on, and you do not need to run the numbers yourself to use them.

Read More – What is Equity-Debt Allocation

How to Check a Fund’s Rolling Returns

You are not expected to compute rolling returns by hand. Independent research platforms such as Value Research, most AMC websites, and distributor platforms including Tata Capital Moneyfy, where you can compare funds side by side on risk and return data, publish mutual fund rolling returns figures and charts for individual schemes.

When you look at this data, match the window to your own investment horizon, typically 3 or 5 years for an equity fund. From there, compare the average rolling return against the fund’s benchmark and category peers, and check the minimum, or worst-case, figure alongside the consistency percentage, since a fund with a merely average return but a strong consistency record often deserves more attention than one with a high average and a wide range of outcomes.

How to Use Rolling Returns to Evaluate a Fund

Rolling returns work best as a structured first filter instead of a shortcut to a single “best fund” answer and applying this to any rolling return mutual fund shortlist you are building keeps the process disciplined rather than reactive. A practical checklist looks like this:

  • Match the rolling window to your horizon. A 3-year window suits a medium-term goal, while a 5-year or longer window suits genuinely long-term equity investing.
  • Compare the average rolling return against the benchmark and category peers. Consistent outperformance across many periods matters more than one exceptional year.
  • Check the worst rolling period. This tells you the kind of downside the fund has actually produced, and not just its best-case story.
  • Look at the consistency percentage. A fund that beats a chosen target in most periods is more dependable than one that occasionally spikes above it.
  • Combine this with volatility, drawdown, expense ratio, and fund-house quality. Rolling returns are the first filter in fund selection, not the only one.

Note that a fund topping a “best rolling returns” list on any given day is not, by itself, a reason to invest in it, and a distributor should not be recommending specific schemes to you on this basis either. If you want guidance beyond your own research, the more appropriate step is speaking with a qualified adviser who can look at your full financial picture, rather than picking a fund off a ranked list.

Read More – Wealth creation strategies for the 50+

Conclusion

A rolling return measures a fund’s annualised performance across many overlapping periods, which is why it reveals consistency instead of the date-dependent snapshot that a trailing 1-year, 3-year, or 5-year figure gives you. Behind every such figure sits the same rolling return calculation, i.e., pick a window, roll it forward across the fund’s history, and look at the spread of results it produces. That makes rolling returns a fairer first filter for long-term fund selection. Look at the average, the range between the best and worst periods, and how often the fund cleared a target return, then weigh all of that against risk and cost before forming a view.

Even so, rolling returns of mutual funds remain a measure of past performance, and not a promise about what comes next. You can use Tata Capital Moneyfy’s comparison tools to look at this data across funds as part of your own research.

Disclaimer: Tata Capital (Moneyfy) is an AMFI-registered mutual fund distributor. Past performance does not guarantee future returns. Mutual Fund investments are subject to market risks; please read all scheme related documents carefully before investing.

FAQs

What is a rolling return in mutual funds?

A rolling return is the annualised return of a fund calculated repeatedly across many overlapping periods of a fixed length, such as 3 years, rather than between two fixed dates. Rolling returns of mutual funds measure how consistently a fund has performed across different market conditions, which is a fuller picture than what rolling returns might suggest from the name alone, and it is the same measure people mean when they refer to a rolling return mutual fund track record.

What is the difference between rolling and trailing returns?

Trailing returns measure performance between two fixed dates, which makes them date-sensitive and easy to skew depending on the starting point. Rolling returns average performance across many overlapping windows instead, which shows consistency across market cycles rather than the result of one specific period.

How are rolling returns calculated?

Rolling return calculation involves choosing a fixed window, such as 3 years, and computing the annualised return for every possible start date in the fund's history, then rolling that window forward to generate many overlapping figures. Analysts then look at the average, the minimum, the maximum, and how often the fund beat a chosen target return.

Why are rolling returns better than point-to-point returns?

Point-to-point returns depend entirely on the two dates chosen, so a lucky or unlucky starting point can distort the picture. Rolling returns remove that dependency by averaging across many periods, which is why they are considered a fairer way to judge a fund's underlying consistency rather than a single measurement.

How do I check a fund's rolling returns?

You can find rolling returns of mutual funds on independent research platforms such as Value Research, on most AMC websites, and on distributor platforms like Tata Capital Moneyfy, which let you compare funds on risk and return data. Match the window shown to your own investment horizon before drawing conclusions from it.

Do good rolling returns guarantee future performance?

No. A strong mutual fund rolling returns record shows that a fund has been consistent in the past, but it does not guarantee the same outcome going forward, since markets, fund managers, and economic conditions all change over time. Rolling returns are best treated as one input among several and not a standalone promise.