Get the Tata Capital App to apply for Loans & manage your account. Download Now

Blogs

SUPPORT

Tata Capital > Blog > Mutual Fund Riskometer: Meaning, Risk Levels and How to Read It

Wealth Services

Mutual Fund Riskometer: Meaning, Risk Levels and How to Read It

Mutual Fund Riskometer: Meaning, Risk Levels and How to Read It

Summary: The mutual fund Riskometer places a scheme’s current portfolio risk on a six-level scale. This guide explains the levels, how to read the scheme and benchmark meters together, why the reading may change and how it differs from the PRC Matrix used for debt schemes.

Every mutual fund scheme carries some level of risk, although the degree of risk can vary widely. To communicate this more clearly, the Securities and Exchange Board of India (SEBI) introduced the Riskometer, a standardised, speedometer-style tool. It classifies schemes across six levels, from Low to Very High, helping investors compare portfolio risk with their own risk appetite and investment horizon. This article explains the mutual fund Riskometer, what its six levels mean, how to read it, how it differs from the Potential Risk Class (PRC) Matrix and how often the displayed reading is updated.

What Is a Mutual Fund Riskometer?

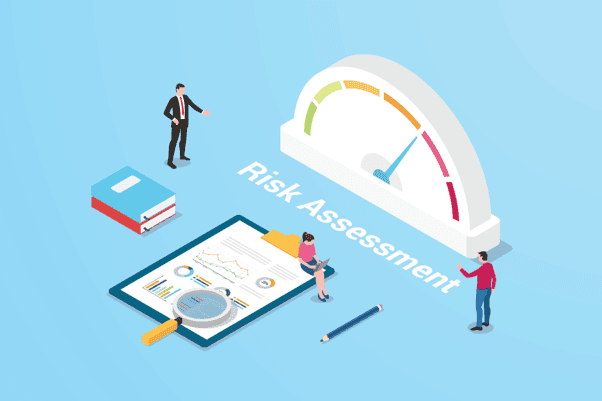
The mutual fund Riskometer is a SEBI-mandated graphic that communicates the risk in a scheme’s underlying portfolio. It resembles a speedometer, with a needle pointing to one of six labels: Low, Low to Moderate, Moderate, Moderately High, High or Very High.

Every asset management company (AMC) must display it for each scheme in documents such as the Scheme Information Document (SID), Key Information Memorandum (KIM), factsheet and advertisements. The level is calculated from the investments held by the scheme and reviewed monthly. It can therefore change when the portfolio or the risk characteristics of its holdings change.

Also Read – Types of mutual funds in India

History of the Riskometer: How SEBI’s Risk Labelling Evolved

SEBI began product labelling through Circular CIR/IMD/DF/5/2013, dated 18 March 2013. It used three colours: blue for low risk, yellow for medium risk and brown for high risk. Circular CIR/IMD/DF/4/2015, dated 30 April 2015, replaced this system with a five-level Riskometer from 1 July 2015.

SEBI Circular SEBI/HO/IMD/DF3/CIR/P/2020/197, dated 5 October 2020, introduced the sixth level, Very High, and monthly portfolio-based evaluation from 1 January 2021. Circular SEBI/HO/IMD/PoD1/CIR/P/2024/150, dated 5 November 2024, added standard colours from 5 December 2024. The history of the Riskometer provides further background.

The Six Risk Levels of the Mutual Fund Riskometer

The six labels appear in increasing order of risk to the principal. Each one describes the portfolio held at that time.

  1. Low: This is the lowest level on the scale. Some capital-preservation-focused portfolios, including certain overnight or highly liquid debt schemes, may receive this reading.
  2. Low to Moderate: The portfolio carries more risk than the Low category, although it remains towards the lower end of the scale. Some liquid, money market or short-duration debt schemes may fall here.
  3. Moderate: This middle reading indicates a greater possibility of movement in the value of the principal. It may appear in some debt, conservative hybrid or balanced-allocation portfolios.
  4. Moderately High: The scheme has meaningful exposure to market or credit movements. Some aggressive hybrid or diversified equity portfolios may receive this classification.
  5. High: The underlying holdings carry high risk to the principal. Some mid-cap, small-cap, concentrated or sector-focused equity portfolios may appear at this level.
  6. Very High: This is the highest reading on the Riskometer. Some thematic, sectoral, small-cap, international equity or other high-volatility portfolios may fall within it.

These examples are illustrative, not permanent classifications. A debt scheme is not automatically Low risk, just as all equity schemes do not carry the same risk. Duration, credit quality, liquidity, market capitalisation and portfolio concentration can affect the reading.

The six-level Riskometer scale is also not a ladder of expected returns. A move from Moderate to High indicates greater risk; it does not promise a proportionately higher return.

Also Read – Thumb rule of investment

How to Read the Riskometer Before You Invest

Finding the needle is easy. Reading it in context requires a few more checks.

  1. Locate the latest disclosure. Check the AMC’s scheme page, monthly factsheet, SID or KIM. An older document may no longer reflect the portfolio.
  2. Read the needle and the label. The needle provides a visual cue, while the written label confirms the official classification.
  3. Check the date. The reading is reviewed monthly, so its date shows which portfolio it represents.
  4. Consider the goal and holding period. A higher-risk portfolio may experience sharper changes in value. That can matter when the money is required soon or the investor has limited capacity to bear a loss.
  5. Compare the benchmark Riskometer. Disclosures show the scheme’s reading beside that of its benchmark index. The comparison indicates whether the portfolio and the market segment used to assess it currently carry similar levels of risk.

If the two readings differ, the gap does not establish that the scheme is better or worse than its benchmark. It shows that the current portfolio carries a different degree of risk from the index. Differences in sector exposure, market capitalisation, duration, credit quality or portfolio concentration may contribute to that result. The latest factsheet can provide more context on the holdings behind the two readings.

The Riskometer describes a scheme, not the person reading it. Personal risk appetite also depends on income stability, liabilities, liquidity needs and the financial effect of a possible loss.

Also Read – ELSS Mutual Funds

Riskometer vs PRC Matrix: What Is the Difference?

The Riskometer and Potential Risk Class (PRC) Matrix both communicate risk, but they answer different questions. The Riskometer applies to all mutual fund schemes. It presents the current overall portfolio risk on a six-level scale and is reviewed every month.

The PRC Matrix applies only to debt schemes and has been mandatory since December 2021. It is a forward-looking 3×3 grid that states the maximum interest-rate and credit risk the scheme is permitted to take. Interest-rate risk is classified through Macaulay Duration, while credit risk is classified through Credit Risk Value.

Put simply, the Riskometer shows the risk currently visible in the portfolio. The PRC Matrix sets the permitted boundary for a debt fund on two specific risk dimensions. The scheme may operate below that boundary at a given time. Reading both therefore provides different, complementary information. As SEBI can revise the framework, current PRC class boundaries should be verified before publication.

Also Read – What is Net Asset Value (NAV)?

Choosing Mutual Funds Based on Risk Level

The Riskometer can help readers separate portfolios carrying substantially different levels of risk. Its relevance, however, depends on the investor’s circumstances.

  • Conservative risk profile: Low or Low to Moderate readings may be more closely associated with the need to limit fluctuations. Some overnight, liquid or short-duration debt portfolios may appear at these levels.
  • Balanced risk profile: Moderate risk mutual funds may include certain debt, conservative hybrid or balanced-allocation portfolios, depending on their current holdings.
  • Higher risk profile: Investors with a longer horizon and a greater capacity to bear market movements may encounter schemes marked Moderately High, High or Very High. These may include aggressive hybrid, large-cap, mid-cap, small-cap, thematic or sectoral portfolios.

Note that these are broad illustrations, not recommendations. A scheme’s name or category does not decide its mutual funds risk level, and two schemes with the same reading can still differ in holdings, concentration, liquidity and investment approach. The Riskometer should therefore be read with the goal, holding period, scheme documents and ability to absorb a possible loss.

Also Read – Accrual funds vs duration funds

How Often Is the Riskometer Updated?

AMCs evaluate each scheme’s Riskometer every month using its actual portfolio at month-end. Under SEBI’s framework, the updated level is disclosed with the monthly portfolio information on the AMC and Association of Mutual Funds in India (AMFI) websites within 10 days of the end of the month. A change in the scheme or benchmark reading must also be communicated to unitholders through the prescribed channels.

Fund houses publish an annual record as well. It shows the reading as of 31 March and the number of times it changed during the financial year. This history indicates whether the classification remained steady or moved frequently, although it cannot predict how the scheme will behave later.

Conclusion

The mutual fund Riskometer is a SEBI-mandated, easy-to-read gauge that presents portfolio risk across six levels, from Low to Very High. Since it is reviewed monthly, it should be read with its disclosure date, the investor’s risk appetite and, for debt schemes, the PRC Matrix. Further educational information is available at Tata Capital Wealth. As the rules may change, verify the latest requirements on the SEBI or AMFI website before publication.

Disclaimer: Mutual fund investments are subject to market risks. Read all scheme-related documents carefully.

FAQs

What Are the Six Risk Levels in a Mutual Fund Riskometer?

The six levels are Low, Low to Moderate, Moderate, Moderately High, High and Very High. They appear in increasing order of risk to the principal. The reading is based on the scheme’s underlying portfolio and may change when its investments or their risk characteristics change.

How Do I Read a Mutual Fund’s Riskometer?

Check where the needle points and read the written label below it. Then check the disclosure date, as the level is reviewed every month. The scheme Riskometer should also be read beside the benchmark Riskometer, which shows the risk assigned to the scheme’s benchmark index.

What Is the Difference Between the Riskometer and the PRC Matrix?

The Riskometer shows the current overall risk in a scheme’s portfolio and applies to all mutual funds. The PRC Matrix applies only to debt schemes. It shows the maximum interest-rate and credit risk that the fund manager can take under the scheme’s stated limits.

How Often Is the Mutual Fund Riskometer Updated?

AMCs evaluate the Riskometer every month using the scheme’s portfolio at month-end. The updated reading is disclosed with the monthly portfolio information on the AMC and AMFI websites. An annual history also shows the year-end reading and how often it changed during the financial year.

Which Mutual Funds Fall Under Moderate Risk?

There is no fixed list based only on scheme categories. Some debt or conservative hybrid portfolios may receive a Moderate reading, but the level depends on the investments held at that time. The latest mutual fund Riskometer provides the applicable classification for an individual scheme.

Does a Higher Riskometer Level Mean Higher Returns?

No. A higher reading indicates greater risk in the underlying portfolio. It does not promise a higher return. The final result depends on the performance of the securities held, market conditions, expenses and other factors affecting the scheme. A higher-risk scheme can also produce a lower or negative return during some periods.