The
CoVID-19 pandemic
has been referred to as the most serious global health emergency since the
1918-1920 influenza outbreak, which claimed the lives of approximately 17-50
million people with 500 million documented cases. Though the current outbreak
isn’t as mortal as the spanish flu, it has already infected millions and
claimed over three hundred thousand lives in just under half a year. It is
clear to experts that these numbers are expected to grow steadily for the
foreseeable future.
The
Pandemic’s true
impact has been felt on the global economy. Its emergence has led to a slump in
consumption and a disruption in the supply chains of all of sorts of goods and
services. Indeed, the outbreak is the natural enemy of a healthy economy, one
which prevents people from partaking in the transactions that generate wealth.
The
fluctuations within Global financial markets are a key source of insight for
those seeking to understand the impacts of COVID-19 on the economy. They have been heavily affected with many
hitting bear territory (a drop of over 20% from recent highs) and growing
steadily more volatile, to say the least. Drops of over 20-30% have been fairly
common with the market shedding nearly $15 trillion of wealth from February
20th onwards. The U.S. market in
particular, saw the fastest fall into bear territory, with the S&P 500
falling 20% in only 16 days. March 2020 has also gone on record as the most
volatile month in the history of the U.S. stock market, with the average daily
swing recorded at 5%. In comparison, the Great Depression of 1929-33 saw an
average daily swing of 3.9%.
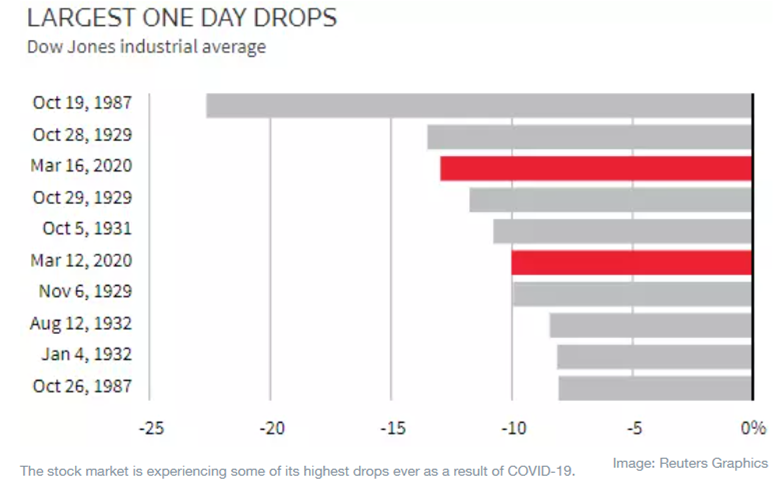
Market
wide circuit breakers designed to halt trade in case of rapid plunges, were put
in place by the U.S. Securities and exchange commission following the October
1987 crash when the Dow
Jones Industrial Average plunged by 22.6%. These circuit breakers had
only been triggered once in 1997 until they were called into action 4 times in
March 2020 alone.
Despite
these worrying events, the
S&P 500 index has managed to bounce back up by 23% from its low on
March 23rd by the second week of April 2020, although stocks are still 19%
lower than their previous high in February. This is an encouraging sign for
investors, as a result of reassurance from government relief packages and low
prices in a rising market. By May, the S&P 500, NASDAQ100 and Russell 2000 had all
fallen by 15%, 4% and 29% respectively from previous highs.
China,
the source of the initial outbreak has seen relatively lower declines in
comparison to the rest of the world with Shanghai falling by 7%, Shenzhen up by
2% and Hong Kong down by 15% in the current fiscal year. They were also the
first nation to enter and exit the pandemic cycle, indicating that recoveries will be manageable
once restrictions are completely lifted and normal economic activity resumes.
The country is predicted to grow at a rate of 1.1% for the rest of the year as
opposed to the pre virus estimate of 5.9%.
While India’s handling of the coronavirus pandemic has fared better
than some of its counterparts with respect to its larger population, Indian indices are among some of
the worst hit by the current crisis. Indices such as Nifty and Sensex have seen drops of 23% in May
from earlier highs in the current financial year. However, this number has also
risen from the 31%-40% drops in March in comparison to earlier highs in
January.
With
regards to other global indices
in May 2020, the Brailian BVSP BOVESPA stands at 31.6% down, the French CAC is
at 25.8% down, the British FTSE 100 is 22.4% down, the German DAX is at 19.9%,
the Japanese Nikkei has seen a 17.% decline and finally, the Russian MOEX
Russia has fallen 13.6% from previous highs in the year.
Conclusion :
While
global financial indices
can provide a rough picture of prevailing investor sentiments and financial
climates during a recession, they do not always provide an accurate depiction
of the actual effects of such situations on economic growth or their potential
for recovery due to their relatively volatile nature. For a thorough
examination, one must use the information gleaned from financial markets in
combination with economic reports of countries and international organizations.
For companies and individuals currently facing the brunt of the
outbreak’s impacts, and seeking to secure their financial security, Tata Capital’s Wealth Management Solutions are perfect. With
a wide range of investment products, a team of dedicated expert wealth managers
and a commitment to personal convenience, Tata Capital’s Wealth Management
Solutions has everything you need in one place.


 4 mins read